How do refresh rate, response time and frame rate differ?
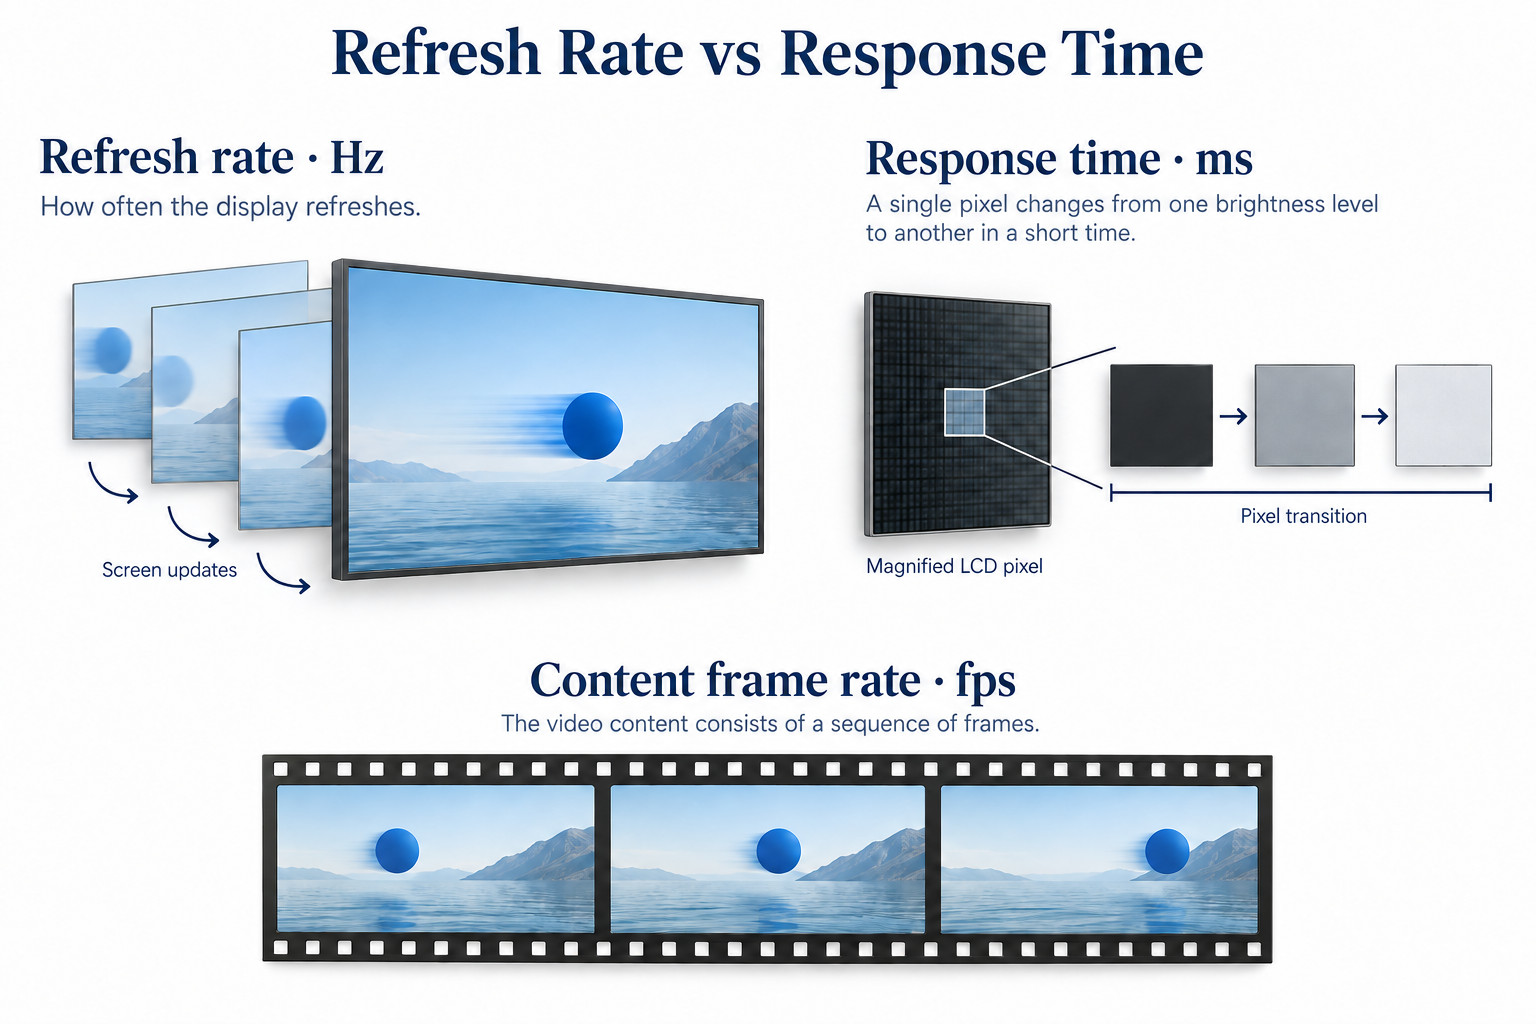
Refresh rate is how often the display updates, measured in hertz. Response time describes a pixel transition in milliseconds. Frame rate describes the content sequence in frames per second.
- Check the supported refresh rate at the intended output resolution.
- Ask which transitions and settings produced the response-time figure.
- Test the actual player and content for pauses, trails or delayed interaction.
- A faster single specification does not by itself guarantee smoother playback.
For commercial signage, start with the content: a mostly static menu, a scrolling information strip and a fast product video place different demands on the system. This guide separates the terms and shows how to investigate motion problems without buying a display around one headline number.
Refresh rate vs response time: the basic difference
Refresh rate is a frequency
A 60 Hz display refreshes 60 times per second. The interval between refreshes is about 16.7 milliseconds. That interval is a timing calculation; it is not the LCD’s response-time specification and does not tell you how long a kiosk takes to react to a tap.
The supported refresh rate can depend on resolution, input and signal configuration. Read the supported-timing table for the proposed commercial display and player. An interface connector’s shape does not confirm every resolution and refresh-rate combination.
Response time is a pixel transition
Response time concerns a change in pixel state. ViewSonic’s explanation of display terms distinguishes refresh rate from response time and identifies gray-to-gray and black-white-black measurements. Compare response figures measured on the same basis rather than treating all millisecond values as equivalent.
A slow transition can leave a moving edge looking smeared. However, motion blur has more than one cause. The source material, processing and the way the image is presented also matter. A low quoted response time is not a promise that all moving content will remain perfectly sharp.
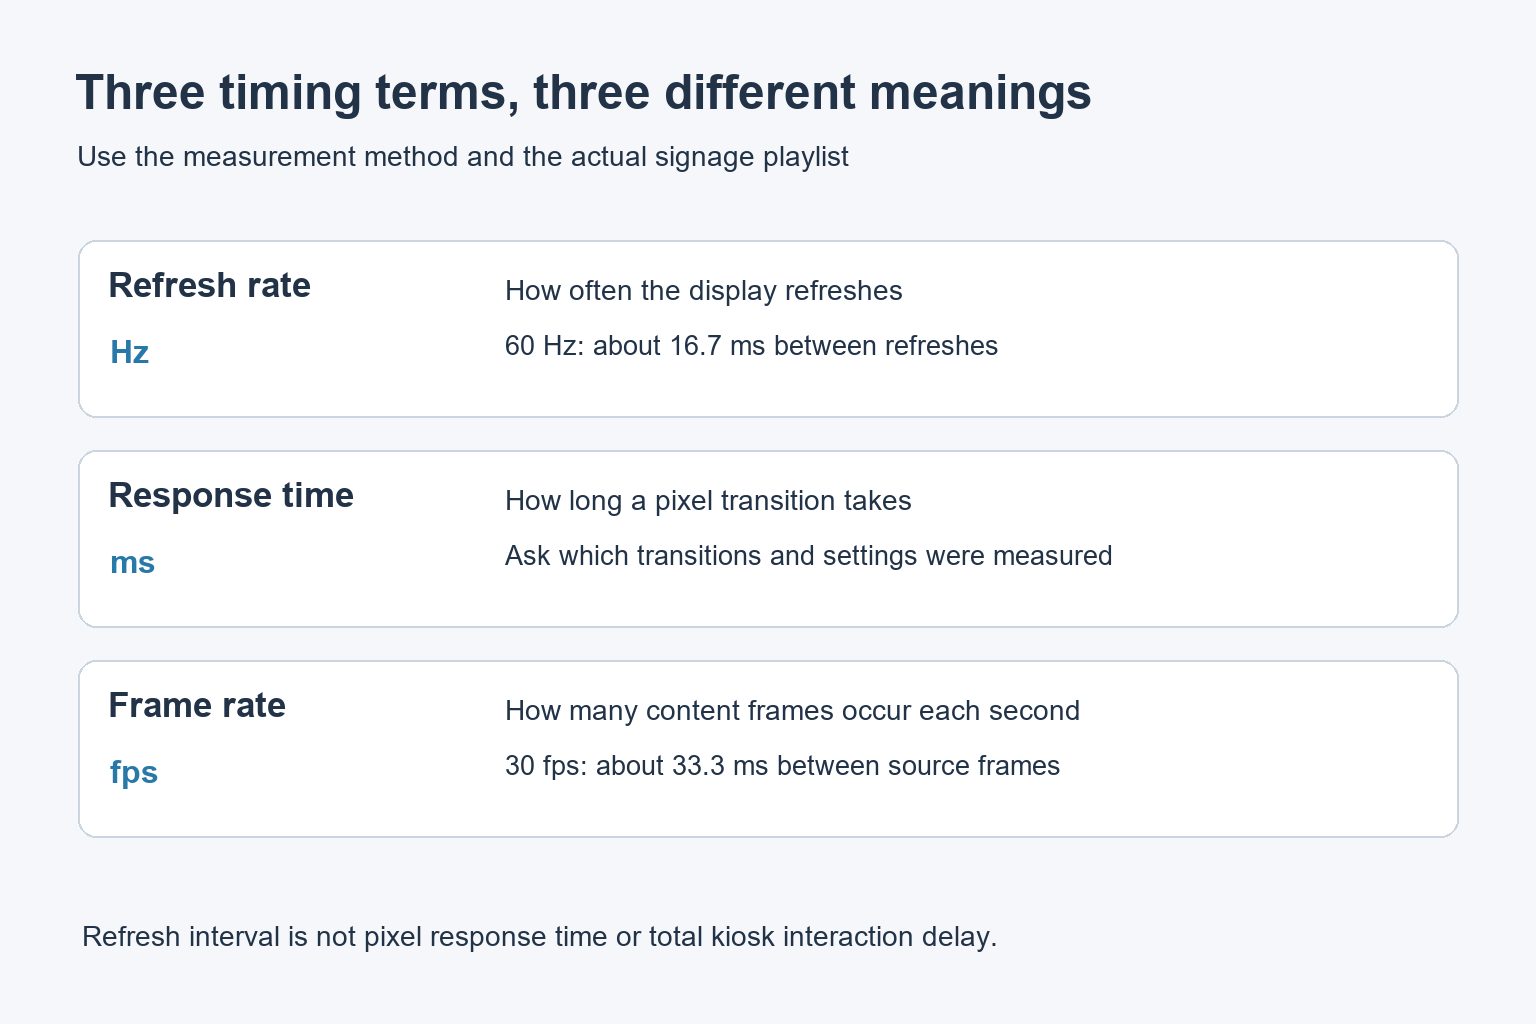
Frame rate is a third number
Frame rate describes the sequence of content images, usually in frames per second. A video file has its own frame rate, while an application may render new frames at a rate that changes with workload. The player’s output timing and the display refresh rate are separate parts of the path.
For example, a 30 fps clip sent to a 60 Hz screen can show each source frame twice. The screen does not create new captured detail simply because it refreshes more frequently. Motion processing may behave differently, so check the selected picture mode rather than assuming what the display does.
Uneven presentation of source frames can make a steady camera pan look irregular. If the file looks smooth on one playback path and jerky on another, compare the source timing, output format and processing. Raising one specification does not necessarily fix the mismatch.
| Term | Unit | Question to ask |
|---|---|---|
| Refresh rate | Hz | Which rate is supported at the chosen resolution? |
| Response time | ms | Which pixel transitions and settings were measured? |
| Frame rate | fps | What is the content rate, and is playback consistent? |
| Interaction delay | Time from action to visible result | Where in the complete kiosk workflow is time spent? |
Read response-time claims with the test method
A display’s fastest measured transition does not describe every possible color change. Ask whether the quoted figure is a typical value, an average or a best-case measurement. Keep picture mode and any response-acceleration setting in the comparison.
Some LCDs use overdrive to speed transitions. EIZO’s technical discussion of LCD video performance explains that excessive overdrive can create overshoot, visible as unwanted edges or false color around moving objects. Use the supported settings and inspect the actual result instead of automatically choosing the strongest mode.
For digital signage, review moving text on both light and dark backgrounds. Then check a product video with fine edges and a slow pan. These examples expose different problems and are more useful than comparing two spec-sheet numbers in isolation.
Match the test to the signage content
Static menus and information boards
If most content stays still, readability, layout and clean transitions may matter more than a higher maximum refresh rate. Check that text is stable, updates appear correctly and scheduled changes do not briefly expose a desktop or loading screen.
Do not animate every element merely because the screen can show motion. Keep prices, directions and essential instructions visible long enough to read. Our digital signage content guide covers these layout and publishing choices.
Scrolling information and product videos
Use the intended scrolling speed, font size and video export settings. A slow sample cannot establish that a faster final design will work equally well. Watch the complete loop, including transitions, rather than checking only a few seconds of one clip.
For synchronized displays, review the shared content across the whole installation. A panel can show smooth video individually while adjacent panels show different moments. Synchronization is a system requirement and should be specified separately from panel response time.
Troubleshoot the symptom before changing hardware
Describe what is wrong as precisely as possible. A trail behind an object, periodic pauses and a delayed button response are different symptoms. Record a short observation and identify the file, application and operating settings involved.
- Play a known, locally stored sample through the planned player.
- Confirm the output resolution and refresh rate.
- Compare the original file with the version uploaded to the content system.
- Check whether pauses coincide with content changes or other player workload.
- Review supported picture and motion settings one at a time.
- Repeat the same sequence after restarting the system.
If local playback is smooth while network playback pauses, investigate delivery and buffering before blaming pixel response. If both show the same trail, compare source material and display settings. Our signage media player guide explains the wider playback requirements.
A phone recording can help show when a problem occurs, but its shutter and frame rate can introduce bands or uneven motion. Treat it as a troubleshooting note. Use the agreed measurement method when a numerical performance claim must be verified.
What to ask before ordering
Provide a representative playlist and specify resolution, orientation and daily operating conditions. Ask which input timings the proposed unit supports, how response time is measured and whether the actual player and files have been tested together.
For commercial indoor digital signage, send YJCEN the content and playback requirements. Confirm the offered configuration before setting a refresh-rate or response-time requirement for the project.
Frequently asked questions
Is 60 Hz the same as 16.7 ms response time?
No. About 16.7 ms is the refresh interval at 60 Hz. Pixel response time is a separate measurement and may vary with the transition and settings.
Will a faster LCD fix a slow self-service kiosk?
Not necessarily. Touch sensing, application logic, network requests, rendering and display processing can all contribute to delay. Test the complete interaction before changing the screen.
Does higher refresh rate improve every advertisement?
No. The source content and playback path must support the intended result. Compare the actual playlist and choose the configuration that meets the project’s visual requirements.